PLEASE NOTE: We are currently not undertaking any framing or restoration work.

THIS IS A REBUBLISHED MAP LAID ONTO CLOTH
Ref: SM005, 1960, A.K.Johnston


Antique star map first published by A.K.Johnston. This map illustrates the visible stars and constellations in the northern hemisphere circa 1860 . The celestial coordinates are shown on the right ascension and declination. The magnitude of the stars, their brightness as it appears as observed from a location on earth, are labelled according to the Bayer system - 24 letters of the Greek alphabet, from Alpha to Omega, with alpha being the brightest on a descending scale thereafter. The size of the stars illustrated is representative of their absolute magnitude, or luminosity, on a scale of 1 -5 with the largest stars being the brightest at magnitude 1. The ecliptic line details the path of the sun across the sky over the course of a year. 'Neb' refers to the clouds of interstellar matter known as nebulae.
21st century Astronomer’s define a stars brightness in terms of magnitude – how bright the star appears from earth, and absolute magnitude or luminosity – how bright the star appears at a standard distance of 32.6 light years. In 150 BC Greek astronomer Hipparchus was the first to make a catalogue of stars according to their brightness on a magnitude scale of 1 – 6, with 1 being the brightest, but the apparent brightness of a star depends on the location of the observer and distance from the star. Stars that are closer to the Earth but fainter, could appear brighter than far more luminous ones far away. Absolute magnitude measures the luminosity of the star – the power of the star – the amount of energy (light) that star admits from its surface, recorded from an equal distance away without any extinction of the stars light by interstellar dust along the line of sight of the observer, for example.
Please see our blog www.foldingmaps.co.uk/blog/mapping-the-stars for further details.
When this map was published:
Stars are born, live, and die, but we see the same stars in our sky today that ancient astronomers saw thousands of years ago and the same stars will still be seen thousands of years from now. This is because stars live for hundreds of millions of years, even tens of billions of years, and over the course of a few thousand years the stars appear not to change at all. Stars like our sun burn for around 9 to 10 billion years. The sun is about halfway through its life so will burn for about 5 billion more years. The precession of the Earth, a gradual shift in the Earth's axis of rotation on a cycle of approximately 25,772 years caused by the gravitational forces of the moon and the sun, means that our perception of north gradually shifts over a 26,000 year period. This precession will steadily cause a shift visible enough that the North Celestial Pole, an area covering a small circle in the sky directly over the North Pole where the heavens appear to turn, will see a succession of stars located closest to the North Pole. From the 4th - 2nd millennium BC it was Thuban, in the constellation Draco, that was the North Star. In the 1960's it was recognised that ventilation shafts constructed within the Pyramids 4,500 years ago were built in alignment with Thuban. The shafts are not straight so it is not possible to view the stars through the shafts but they align with the area of sky where Thuban would have shone brightly. Our current North Star is Polaris, in constellation Ursa Minor. It is possible to map and predict these changes and 12,000 years from now Vega, in constellation Lyre, will be the North Star, and in 26,000 years it will be back to Polaris once again.
Centuries before compasses and satellite navigation systems, people navigated by the stars. This is called Celestial navigation. In the Northern Hemisphere the Pole Star located almost directly about the North Pole was used to tell navigators true north. Once north was found the other directions could be worked out. Ground position (GP) can be stated in celestial coordinates as at a given time, any celestial body such as the sun is located directly over one point on the Earths surface. In c.1730 English mathematician and inventor John Hadley invented an instrument called a quadrant that could be used by sailors to measure the altitude of the Sun or star above the horizon to find their geographical position at sea. The quadrant later developed into the sextant.
| Laid on cloth in a marbled slip case | £54.00 |
Small maps are laid as one piece all others are dissected - See here
All prices include VAT and free UK shipping. There may be additional charges for shipping outside the UK.

These extremely rare maps have been in existence since they were originally printed and are not modern reproductions.
Shop Now
Modern reproductions of antique maps - professionally created to closely match the original production methods.
Shop Now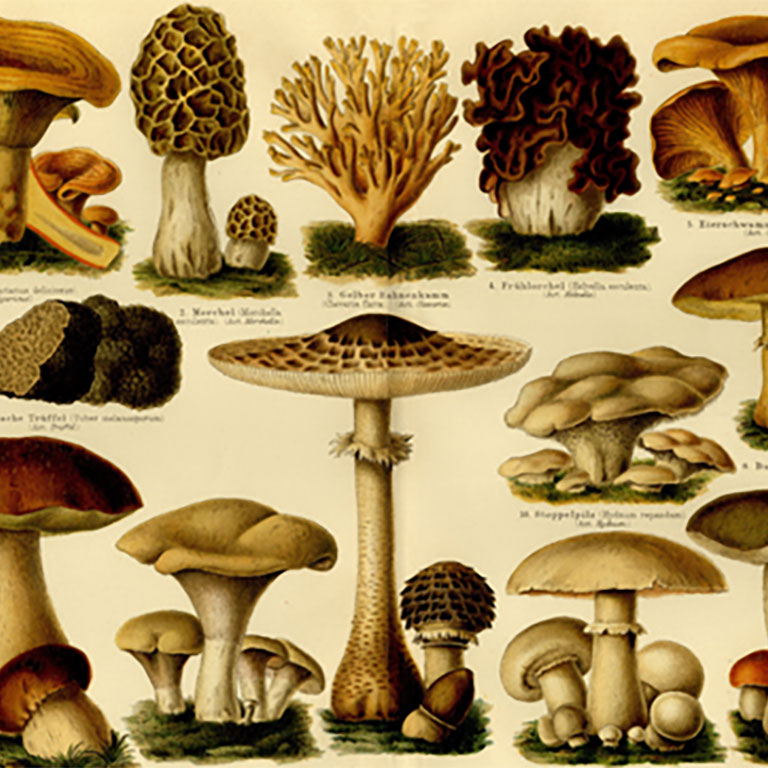
An eclectic range of antique illustrations. Available in a hand-made frame or supplied rolled in a tube.
Shop Now

A map designed by Edward Stanford (1827 - 1904) who was a map maker and seller prominent in the late 19th century.
Shop Now
Charles Booth's Descriptive map of London Poverty first published circa 1889. Available in area sectionals.
Shop Now
Horwood's Old map of London, first published circa 1799. This map is very large and is available to purchase in sections.
Shop NowAVAILABLE FROM THIS WEBSITE AND ALSO FROM:



