PLEASE NOTE: We are currently not undertaking any framing or restoration work.

THIS IS A REBUBLISHED MAP LAID ONTO CLOTH
Ref: Met010, 1889, The Geographical Institute


Isotherms: South Africa & S.E Australia. Isotherms are lines denoting equal temperature (Greek). The temperature of the air at any place depends on many factors, of which altitude, latitude, distance from the sea, temperature of the sea, and exposure are the chief. Altitude and latitude are the most important. The mean temperature falls about 5.5 degrees C. for every 1000 metres of ascent; but in the Northern Hemisphere, between 30 and 70 degrees N., the mean temperature decreases only 0.75 degree C. for every increase of a degree latitude; i.e 0.0068 degree C for every km nearer the pole. The temperature therefore falls 800 times more in the same distance in a vertical temperature direction than in a horizontal one.
The temperature and pressure maps of the World are based on the observations of 1539 and 1280 land stations repectively during fifteen years. If we assume only two daily observations at each station, this means that the world maps of annual temperature summarises about 17,000,000 observations, and those of annual pressure at least 14,000,000 observations, excluding all observations made at sea. The climate maps of the countries shown in greater detail are usually based on returns from many more stations for much longer periods. For instance, the annual temperature map of the British Isles summarises at least 4,250,000 observations, and that of temeprature nearly 5,000,000 observations.
The rainfall maps of the British Isles and central and southern Europe and South Africa are based on returns for a definite period. The other maps are made for the longest means available, but have been specially treated. The rainfall maps are based on returns from many more stations than the others. The annual map of the British Isles summarises the daily observations at nearly 760 stations during 25 years, or nearly 7,000,000 observations. About 1100 stations were used to make the rainfall maps, compared with 100 for the temeprature maps of India. The annual rainfall map of the World summarises the records of nearly 9000 land stations, two-thirds of them in Europe.
| Laid on cloth in a marbled slip case | £54.00 |
Small maps are laid as one piece all others are dissected - See here
All prices include VAT and free UK shipping. There may be additional charges for shipping outside the UK.

These extremely rare maps have been in existence since they were originally printed and are not modern reproductions.
Shop Now
Modern reproductions of antique maps - professionally created to closely match the original production methods.
Shop Now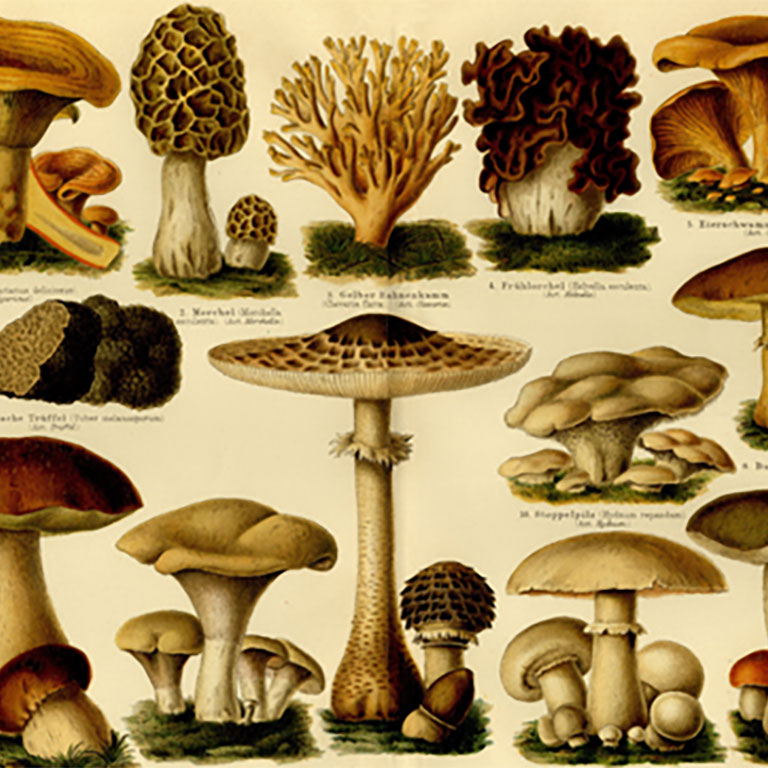
An eclectic range of antique illustrations. Available in a hand-made frame or supplied rolled in a tube.
Shop Now

A map designed by Edward Stanford (1827 - 1904) who was a map maker and seller prominent in the late 19th century.
Shop Now
Charles Booth's Descriptive map of London Poverty first published circa 1889. Available in area sectionals.
Shop Now
Horwood's Old map of London, first published circa 1799. This map is very large and is available to purchase in sections.
Shop NowAVAILABLE FROM THIS WEBSITE AND ALSO FROM:



